10.5 Control Charts
Automating QC plots. Per Analyte, Instrument and Reference Sample
Disclaimer |
|
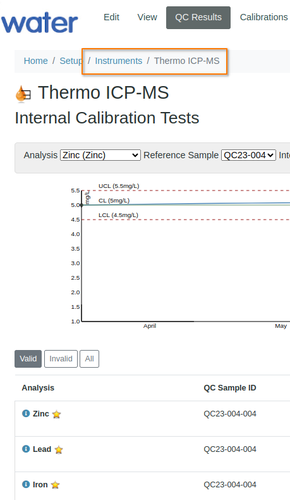
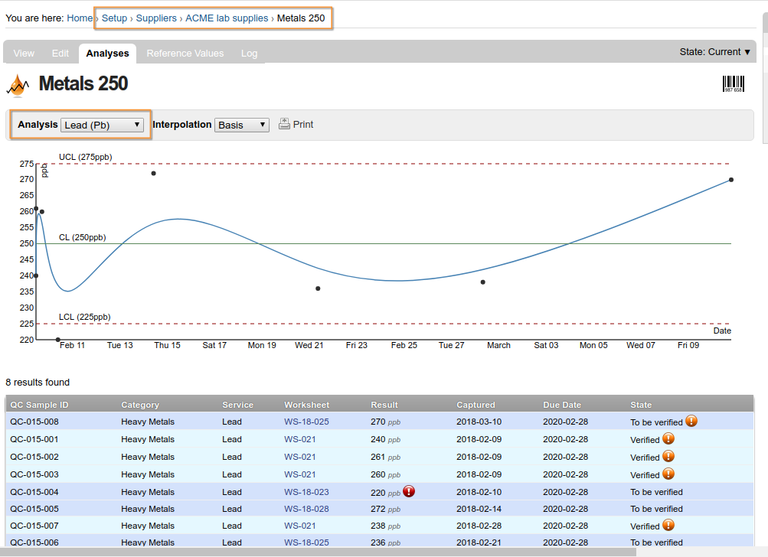
Control Chart dataQC results are captured on Worksheets but technically live on the Reference Sample used's record They are reached from the Analyses tab from the Reference Sample's tabs Alternatively from the Supplier's pages Per InstrumentThe results can be accessed and graphed as Control chart from the Instrument's QC results tab and a specific reference Sample selected
|
Users may select which Analysis to plot and which type of interpolation to use The results used in the graph are tabled and can be investigated via their hyper links |


