1.1.6 Dashboard
Disclaimer |
|
|---|---|
|
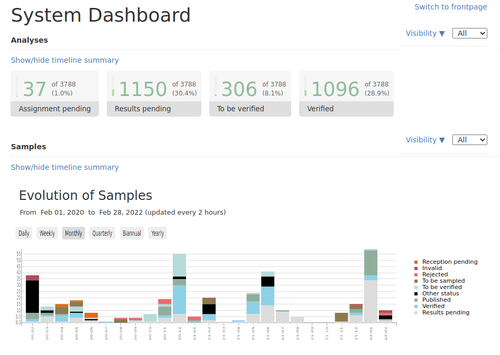
If configured for it, the front page of the LIMS will always display the current states of Samples, Worksheets, and their Analyses in a series of cards with totals on them. Additionally, the cards can be extended to create a bar graph for a given period of time, which can range from daily to annually This is accomplished by the use of a legend located to the right of the bar graphs, which displays each state in a distinct colour. Here the Sample chart was left untouched and Analyses expanded, measured monthly (on demo data, not very good)
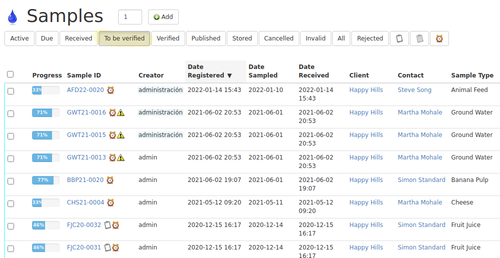
The user can access the list of those items, such as Samples to be Verified, by clicking on the bottom tab of the cards that show the totals of the objects in their various states.
|
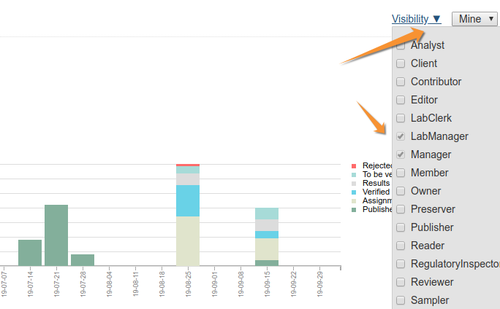
Lab managers may configure which user groups get to see the different bargraphs and totals
|


