Bika Concrete
Disclaimer |
|
|
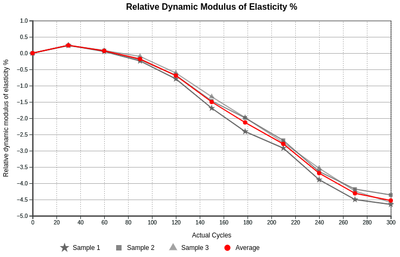
OverviewBika Concrete adds Time Series Results and Batch Mix management to Bika's standard ISO 17025 functionality A concrete or mortar mix's recipe ingredients, Mix Materials and a number of key parameters are maintained Sample Batch's Mix tab - lab and mix temperatures, volumes, design and measured air content,, for concrete, designed and measured slump; followed by a list of Materials and their attributes A lot of concrete testing takes place over several weeks after an object was cast, measured regularly, say weekly. Bika Concrete's Time Series Results capture summarised results from standardised spreadsheets, the table and plot the results MaterialsClasses, typically: Cement, SCM, Filler, Aggregate, Admixture, Fiber and Water Each can have multiple types, e.g. Class Aggregate with types Coarse Aggregate, Fine Aggregate, Manufactured Sand and Natural Sand; or Water with types City Water and Recycled Water
|
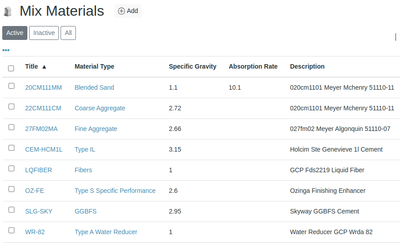
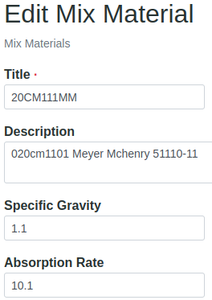
MixesBatch concrete and mortar mix information can be uploaded to Bika Batches, in this first release it serves as reference to Analysis results on Sample views and COAs. It excludes the frequently modified formulating of the mixes currently handled in the spreadsheets before importing key mix information and Material components Setting up Mix MaterialsMaterials are always listed in the lab's preference, structured in Material Types belonging to a handful of Material Classes. e.g in this order: Cement, SCM, Filler, Aggregate, Admixture, Fiber, Water There are a number of configurable Material Types per Class To configure this, sequentially navigate In the Bika Setup to and capture data for Material Classes and Material Types, eventually Mix Materials themselves Each Mix Material is captured with attributes for Title, Material Type, Specific Gravity, Absorption Rate, Description, Supplier and Manufacturer
|
Time Series ResultsTwo new attributes, Curing Method and Cast Date are available for concrete samples The Time Series Analysis type is typically used for Analysis Services like Percentage Shrinking and Percentage Mass Change and results recorded over time an then table and graphed on the Sample view and eventually the COA
|


