Using Time Series Analyses
Disclaimer |
|
|
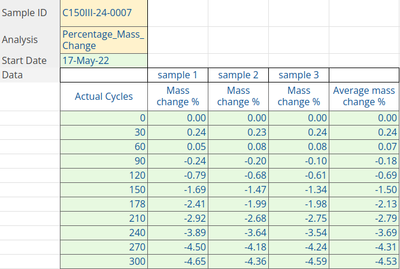
Creating a Time Series AnalysisWhen creating Samples as per normal, simply select the Analysis on the Sample registration form like any other. When the Sample is created, all Time Series Analyses are listed below the routine results. At this stage only the results table's column headers are displayed Collect the results in a spreadsheetAt the writing of this page, results can only be imported from spreadsheets to TS Analyses and not captured in the UI. Some labs will use a set of sheets to collect raw data in, from which the data points to be tabled and graphed in the LIMS are extracted to a summary sheet of fixed format, which is then imported, manually in this example, to be automated. The (MS xlsx) sheet should look like this and carry the Analysis' keyword in its title. Only the cells shaded green are imported. Those shaded yellow are used for referencing the correct Sample and Analysis in the LIMS, the Sample ID and Analysis keyword must go in there
|
Importing Time series resultsIf not automated, the user must import the spreadsheet to reflect the latest data in the LIMS. Navigate to Instrument Import from the icon at top right of the screen
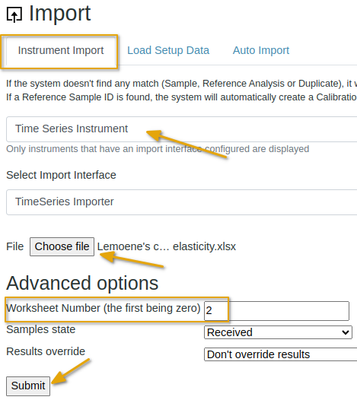
Select the Instrument Import tab, the Time Series Instrument to use and the xlsx to import NB Worksheet number Because some spreadsheet books can include results for more than one Analysis, the user has to indicate which sheet to import, giving the sheet number, starting with 0, i.e. 0, 1, 2, 3, 4 from left to right. Note that the most LH sheet gets the number 0 In this example the third sheet, number 2, will be imported:
|
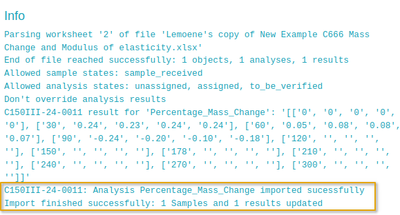
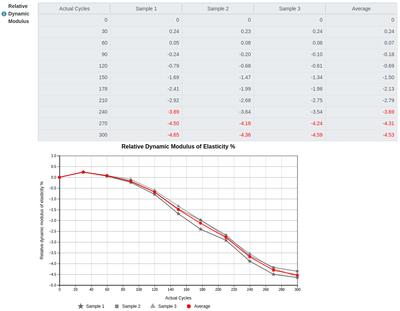
The import trace will report any errors found in the file. These can be quite cryptic - if you cannot work out what to fix, log an issue in the Bika tracker including the importer's traceback. Upload the import xlsx to the project's private online folder and share the link in the issue A successful import's traceback will report like this: When you refresh the Sample view, the Time Series table will be populated with the imported data indicating out of range results, and graphed just below it Spreadsheet Uploaded as attachmentFrom release 1.0.2, the imported spreadsheet is also uploaded to the Sample, like for instrumemt imports, and always available as reference
|


